Understanding Your Pathology Report
Gleason Scoring
During the analysis of a biopsy, if malignant tissue is detected it receives a Gleason score. This scoring system numerically measures the abnormality of the glands (groups of cells) in your tissue biopsy.
If the glands look abnormal, the pathologist will give the tissue a score between 3 and 5. If cancer is present the tissue’s Gleason score is determined by adding two patterns of tissue with the most cancer together, this gives a Gleason score between 6 and 10. This scoring helps your doctor determine how aggressive the cancer may be.
Anatomy of Gleason Score

The first number represents the grade with the most present cancer pattern. In this case, there is more grade 3 than grade 4. If the score were 4+3=7, there would be more grade 4 present than grade 3.
The last number is the Gleason sum, which typically ranges from 6-10 when a tumor is present. The higher the score the more likely the cancer will grow and spread quickly.
Gleason Groups
In addition to Gleason scores, pathologists use what are called Gleason groups. This grouping can help give a clearer picture of what you score means. Many labs include both the Gleason Score and Gleason Group on your report, however some may only use one. The table below defines the groupings and their level of risk.
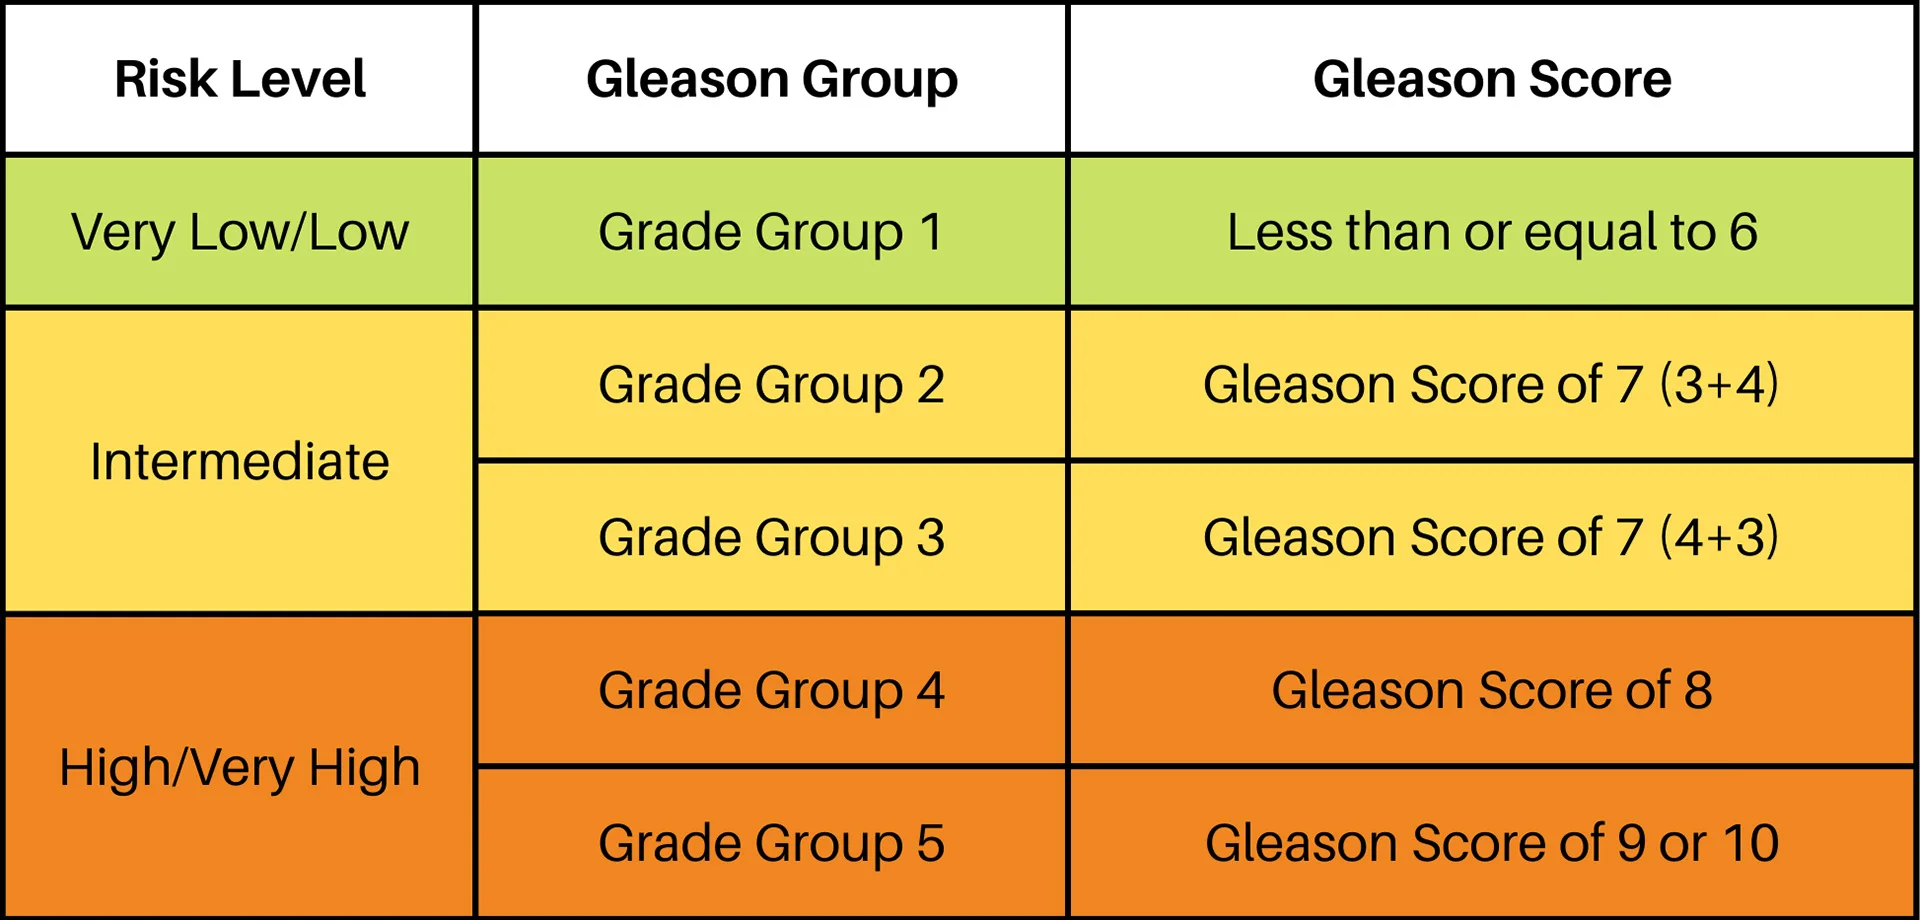
Typically, the higher the number, the higher the risk. However, having a high Gleason group/score doesn’t always result in immediate treatment. There are many factors that contribute to a diagnosis and its severity. Gleason groups and Gleason scores tell you how developed the cancer is in a specific area or core, and a typical prostate biopsy includes 12 separate cores.
Your doctor will take into consideration all the information provided to them along with your health factors. In addition to the Gleason groups and scores these factors could include how many cores are affected, your PSA level, your age, your overall health, and any other risk factors you may have.
Diagnosis Box

a. Result Summary – Tells whether cancer was found. Malignant means that cancer cells were present. Benign means that cancer cells were not present.
b. Cores Involved – Tells how many of the cores biopsied have cancer present.
c. Gleason Group – Tells which Gleason Group your tissue has been catergorized as. (Refer to Gleason Groups for more info)
d. Perineural Invasion (PIN) – Perineural invasion is when cancer cells wrap around a nerve. This section tells whether perineural invasion was present in your tissue.
e. Extraprostatic Extension (EPE) – Extraprostatic extension is when cancer has spread out of the prostate and into other nearby tissue. This section tells whether extraprostatic extension was present in your tissue.
Critical Comment

Critical Comment – Critical Comment boxes are used by pathologists to share case specific information directly with your physician.
Prostate Map and Tissue Core Stats
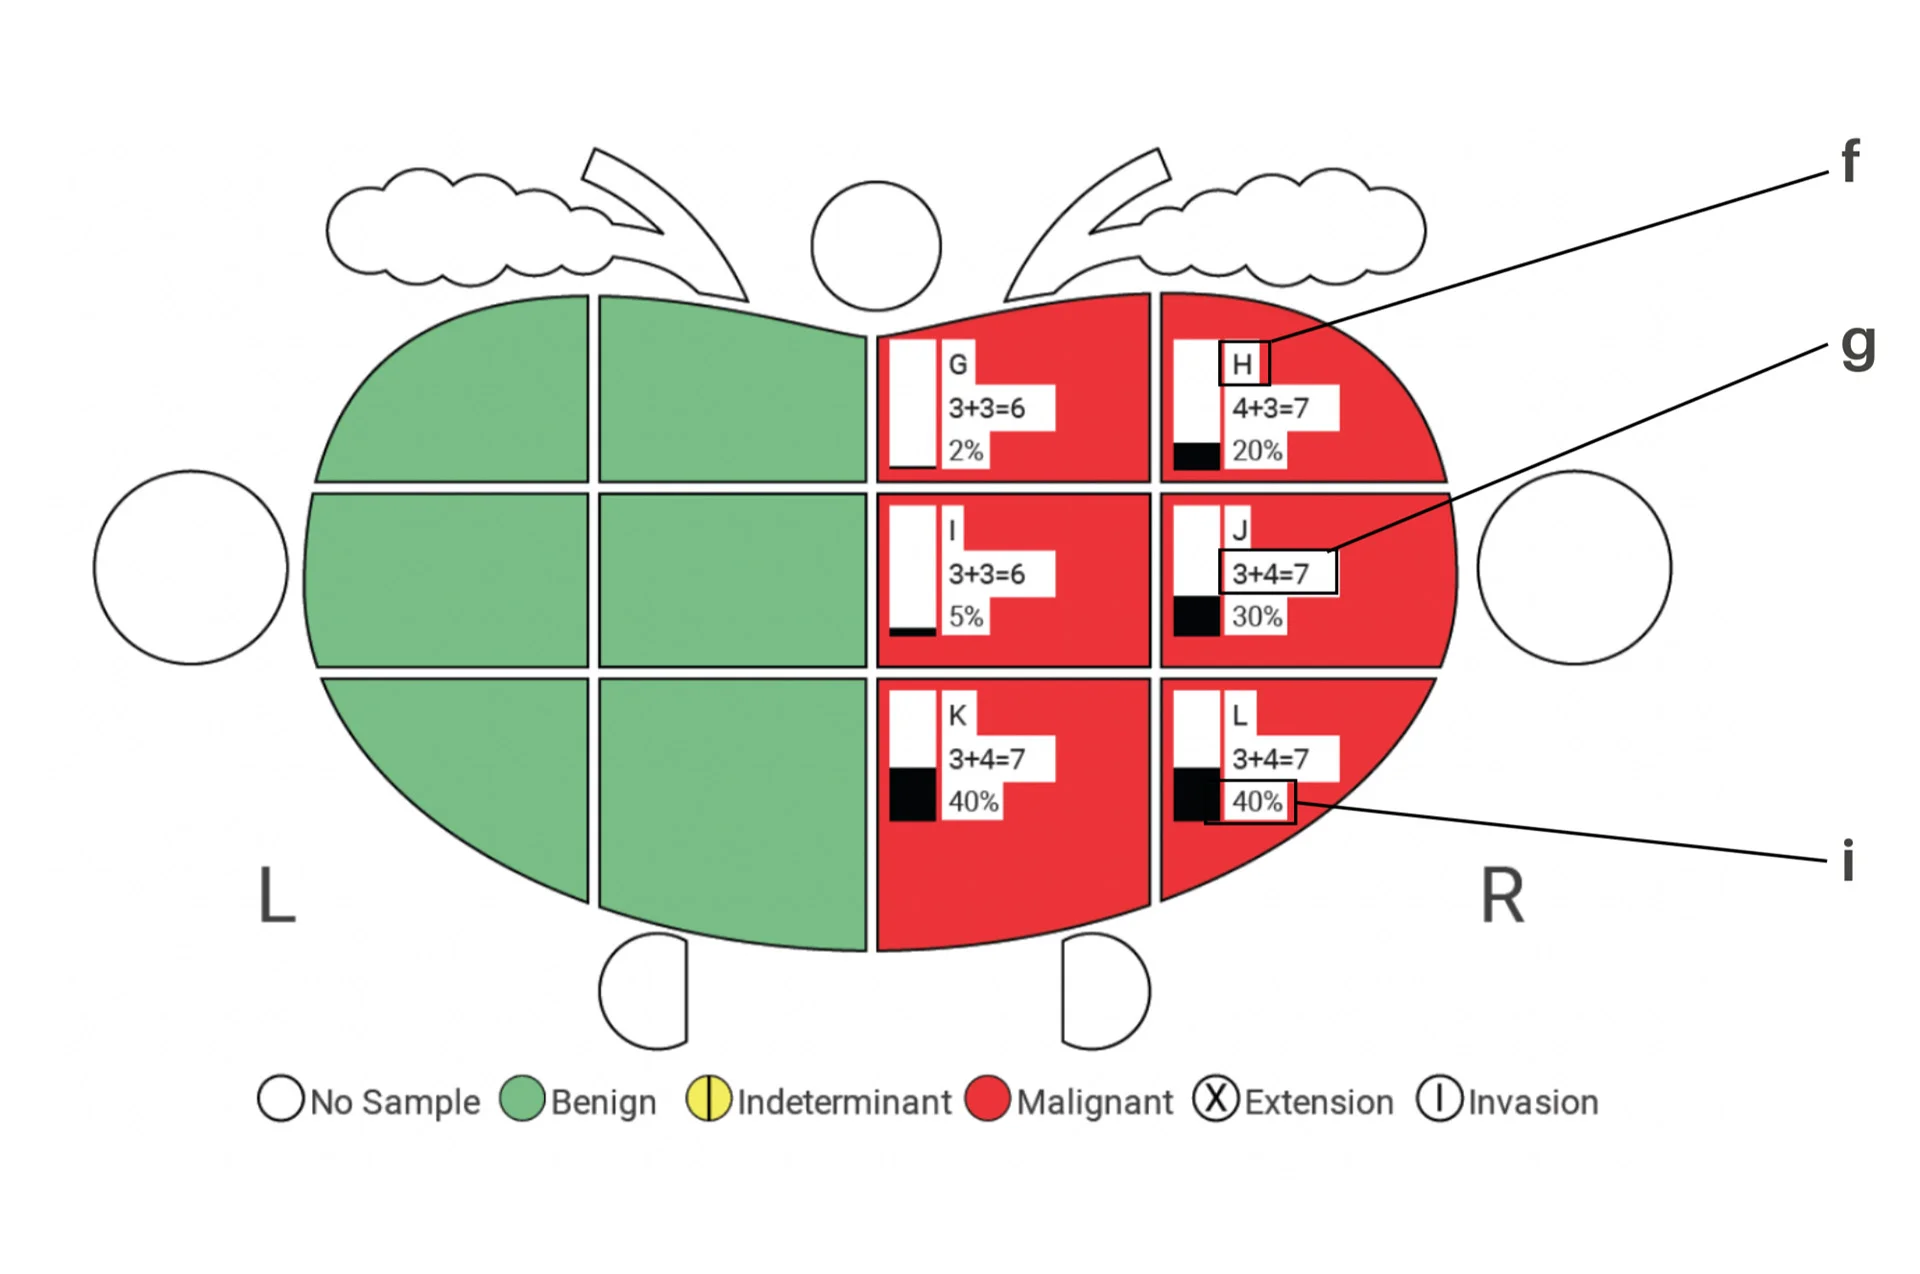
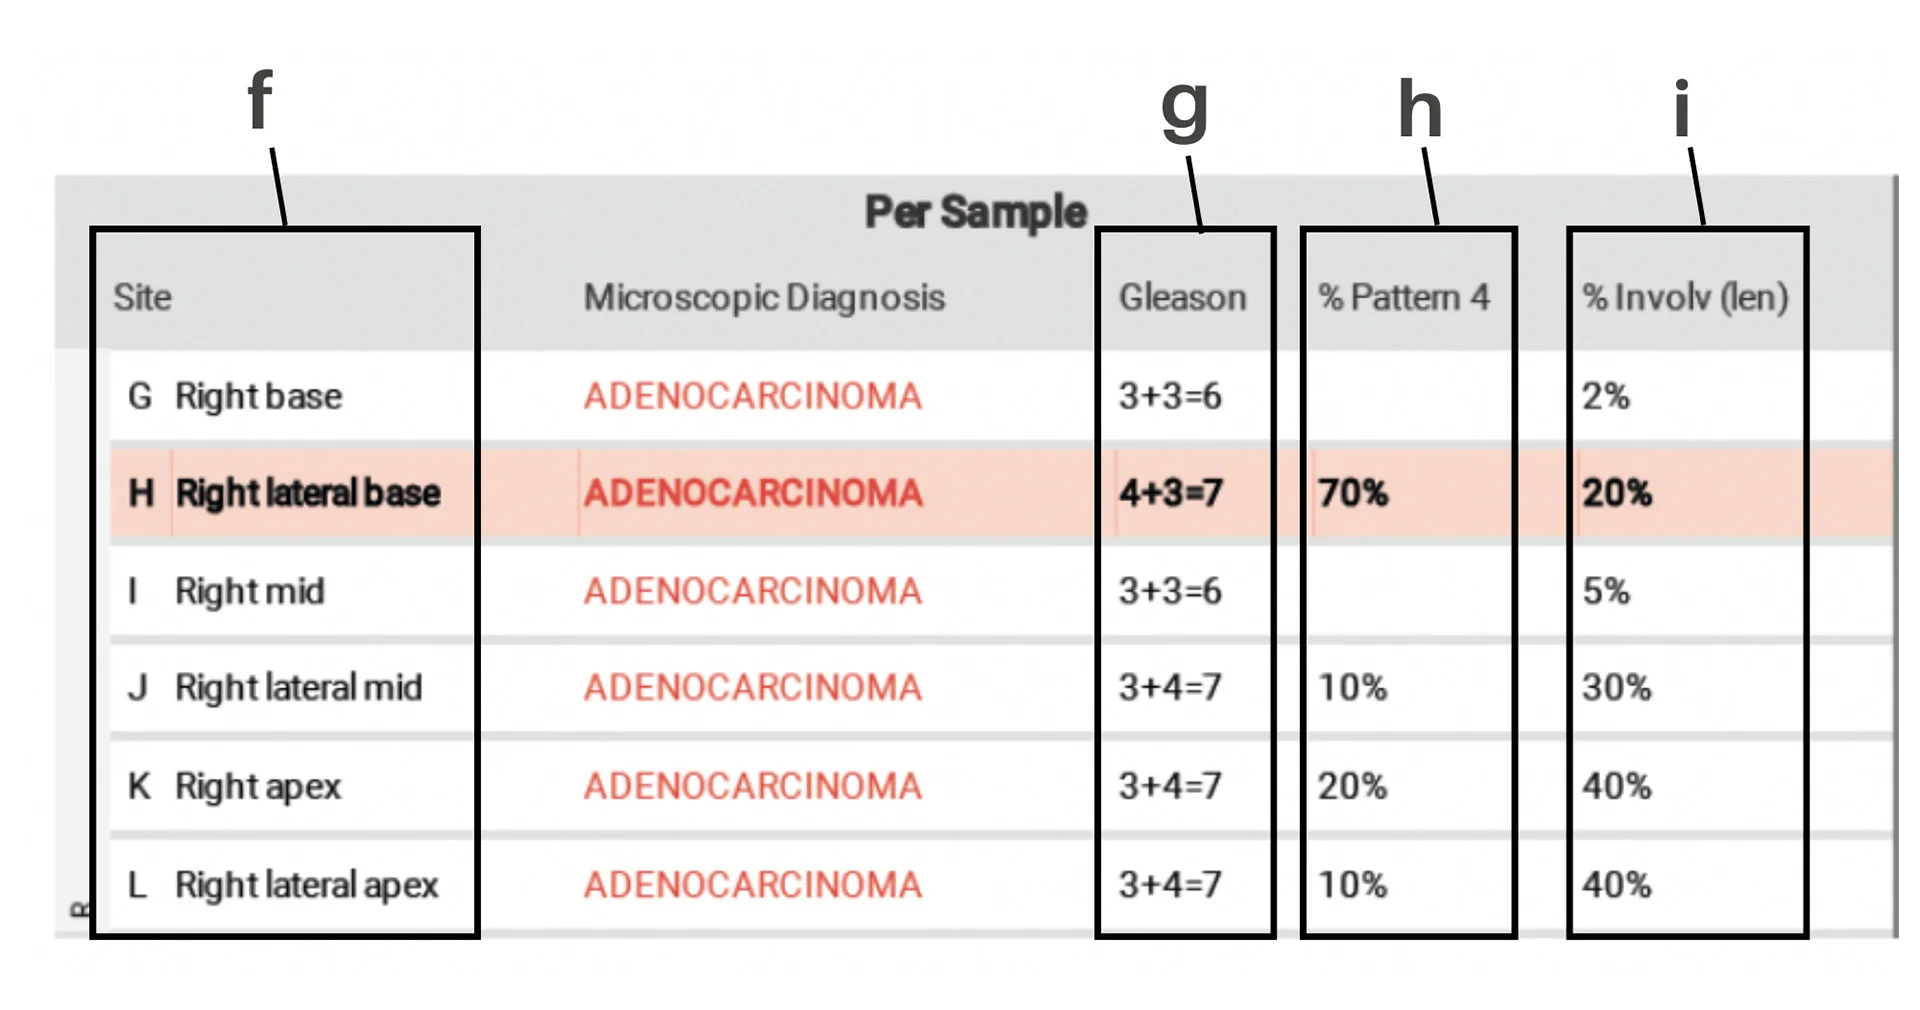
f. Site – Tells which area of the prostate the data was collected from. Letters on the table correspond with the graphic above.
g. Gleason Score – Tells you the pattern of cancer found and which pattern is most present in the tissue.
h. % Pattern 4 – Tells you what percentage of the cancer found (if any) is pattern 4
i. % Involvement – Tells you what percentage of each tissue sample contains cancer.
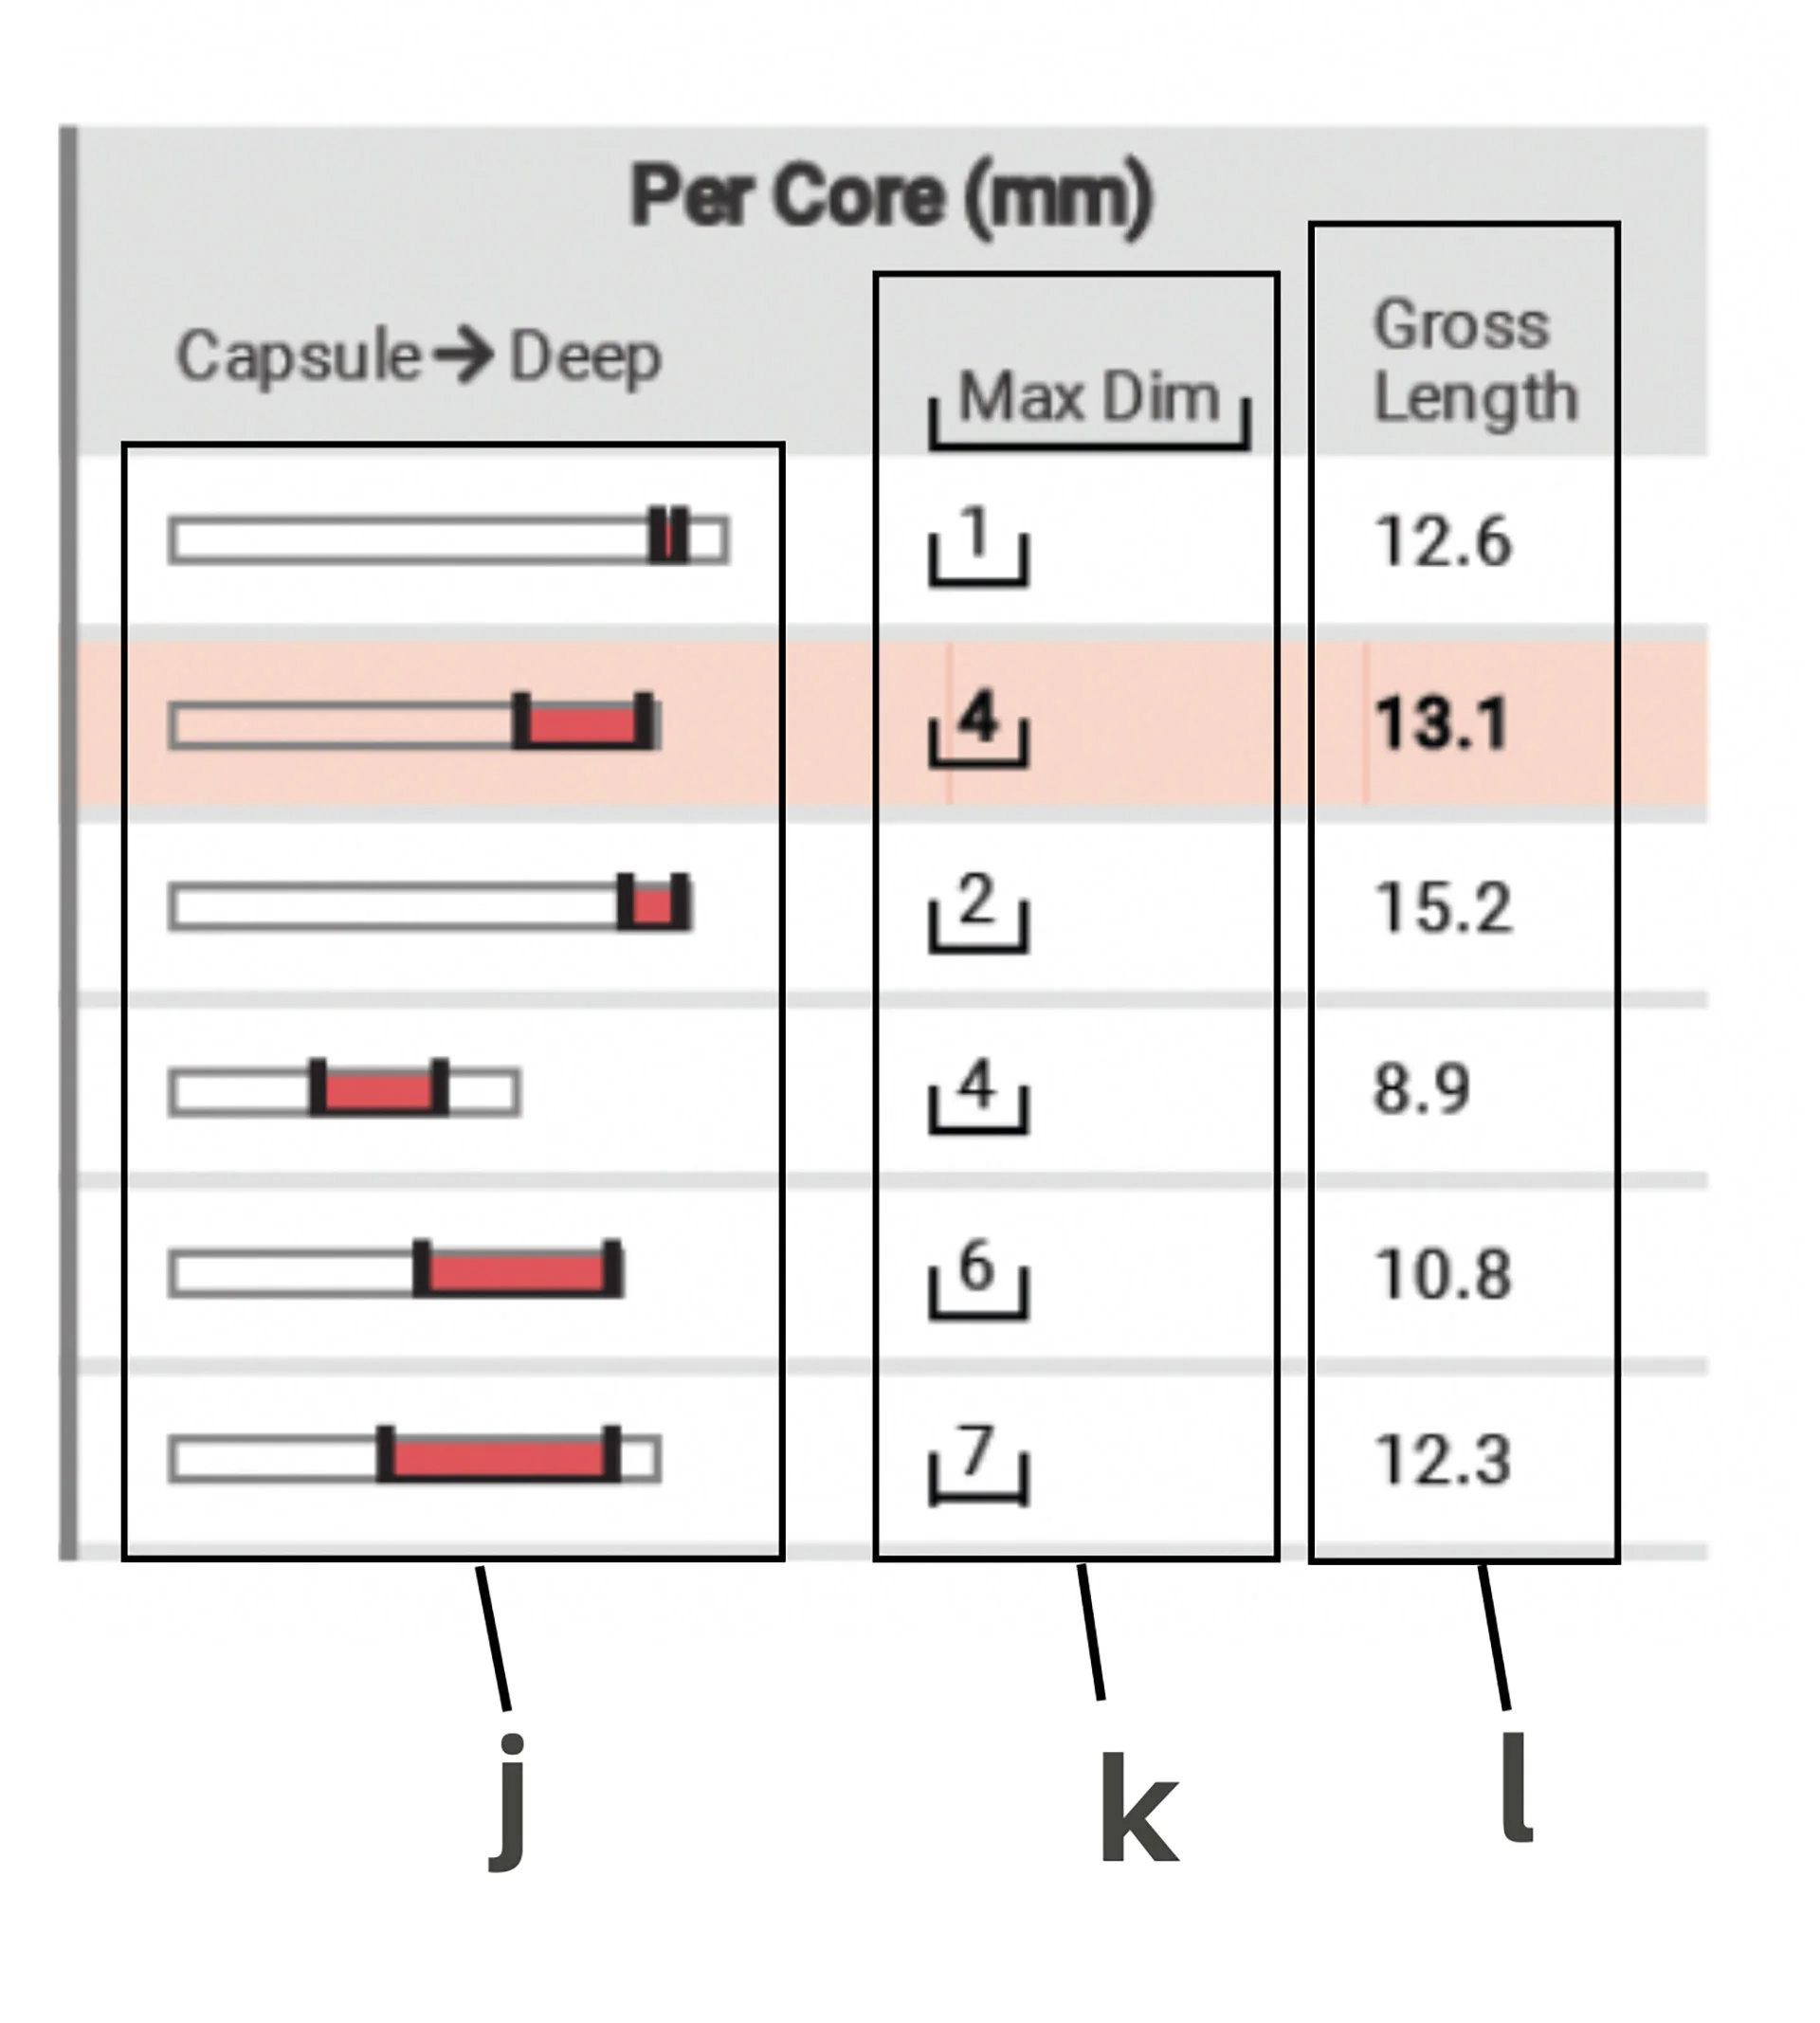
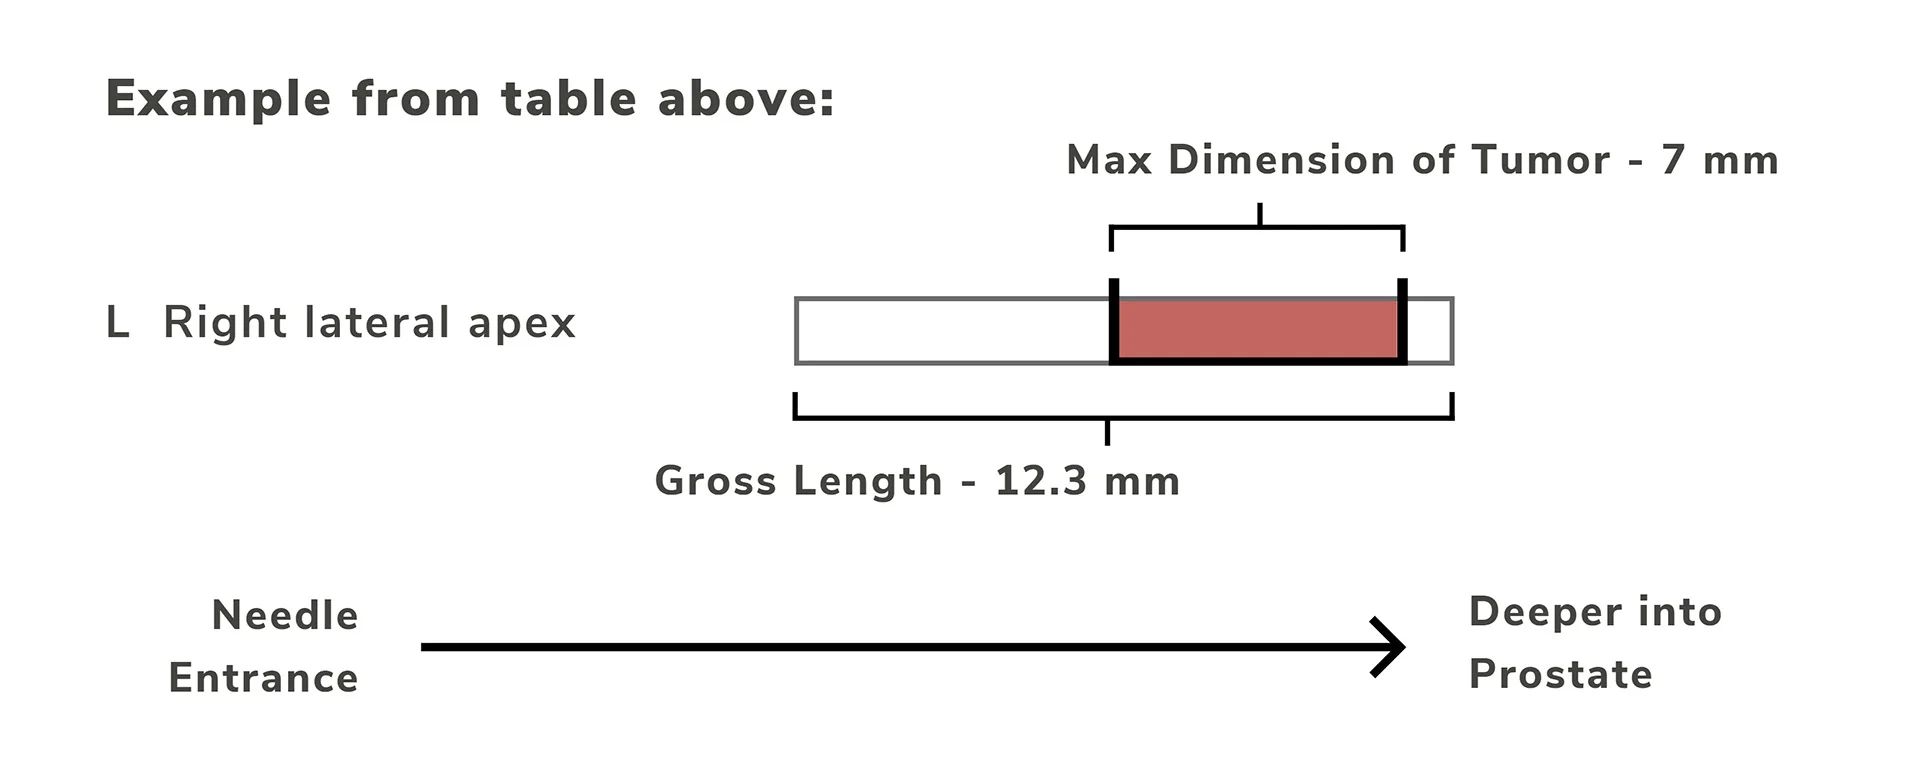
j. Core Diagram – This diagram represents your tissue core visually. The red section represents the portion of your tissue where tumor was found in.
k. Max Dimension – The max dimension number tells you the length of the tumor in each tissue core.
l. Gross Length – The gross length tells you the full length of each tissue core.
Partin and Han Tables

Partin Table
The Partin Table is a predictive tool used to estimate the likelihood of prostate cancer spreading beyond the prostate gland. It analyzes three key factors: PSA (Prostate-Specific Antigen) levels, Gleason score (a measure of cancer aggressiveness), and clinical stage (the extent of the cancer). This table helps physicians determine whether the cancer is confined to the prostate or has spread, guiding decisions about the most effective treatment options before surgery.
Han Table
The Han Table predicts the likelihood of prostate cancer recurring after surgery. It uses PSA levels, Gleason score, and clinical stage to assess the risk of recurrence. By providing this information, the table helps physicians develop personalized follow-up and treatment plans to address potential cancer recurrence.
For more information on how the Partin and Han Tables apply to you, consult your physician.

